Introduction
In the modern digital landscape, the stability of an organization’s infrastructure relies heavily on the robustness of its connectivity. Network Monitoring is no longer just about ensuring a server responds to a ping; it is a sophisticated discipline involving the continuous analysis of a computer network’s components to ensure optimal performance, availability, and security. For the System Administrator, Network Engineer, and DevOps professional, visibility is the currency of reliability.
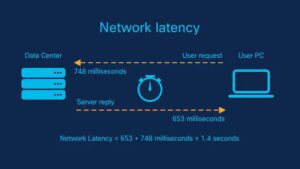
As networks evolve from static, on-premise hardware to dynamic Cloud Networking and Software-Defined Networking (SDN) architectures, the tools and methodologies used to monitor them must also adapt. We are moving away from reactive troubleshooting—waiting for a user to complain that “the internet is slow”—toward proactive observability. This involves tracking Bandwidth usage, Latency, Packet Loss, and Jitter across complex topologies that include Wireless Networking, Edge Computing, and Microservices.
This article provides a comprehensive technical deep dive into building and maintaining effective network monitoring solutions. We will explore the fundamentals of the OSI Model, dive into Network Programming with Python, examine how to visualize data using modern JavaScript frameworks like React, and discuss the security implications of monitoring architectures. Whether you are managing a corporate data center or enabling Remote Work for a team of Digital Nomads, understanding these layers is critical.
Section 1: Core Concepts and Network Data Acquisition
To effectively monitor a network, one must understand the underlying protocols that transport data. The TCP/IP model governs how data flows across the internet. At the lower levels, we deal with Ethernet frames and IP packets; at the higher levels, we analyze Application Layer protocols like HTTP, HTTPS, and DNS.
The Role of Protocols in Monitoring
Network monitoring generally falls into two categories: **Active Monitoring** (generating traffic to test reachability) and **Passive Monitoring** (capturing existing traffic for analysis).
1. **ICMP (Internet Control Message Protocol):** The backbone of the `ping` command. It is used to diagnose network connectivity issues.
2. **SNMP (Simple Network Management Protocol):** A standard protocol for collecting and organizing information about managed devices on IP networks. It allows Network Administrators to modify that information to change device behavior.
3. **Packet Analysis:** Using tools like Wireshark or `tcpdump` to inspect the payload and headers of packets. This is crucial for deep Network Troubleshooting.
Programmatic Network Discovery
In a modern DevOps Networking environment, we rarely check devices manually. Instead, we use Network Automation. Below is an example of a Python script utilizing raw Socket Programming to scan a subnet for active hosts. This demonstrates the interaction with the Transport Layer and Network Layer.
import socket
import ipaddress
import threading
from queue import Queue

# Define the target subnet using CIDR notation
TARGET_SUBNET = "192.168.1.0/24"
OPEN_PORTS = []

def port_scan(target_ip, port_num):
    """
    Attempts to create a socket connection to a specific IP and Port.
    This simulates a basic TCP handshake to check service availability.
    """
    try:
        # AF_INET refers to IPv4, SOCK_STREAM refers to TCP
        sock = socket.socket(socket.AF_INET, socket.SOCK_STREAM)
        sock.settimeout(0.5) # Low timeout for speed

        result = sock.connect_ex((str(target_ip), port_num))
        if result == 0:
            return True
        sock.close()
    except Exception as e:
        pass
    return False

def worker(ip_queue):
    while not ip_queue.empty():
        ip = ip_queue.get()
        # Scan common ports: 80 (HTTP), 443 (HTTPS), 22 (SSH)
        for port in [80, 443, 22]:
            if port_scan(ip, port):
                print(f"[+] Device Active: {ip} on Port {port}")
        ip_queue.task_done()

def main():
    print(f"Starting Network Scan on {TARGET_SUBNET}...")

    # Create a queue for threading
    q = Queue()

    # Generate all IPs in the subnet
    network = ipaddress.ip_network(TARGET_SUBNET)
    for ip in network.hosts():
        q.put(ip)

    # Launch threads for concurrent scanning
    for _ in range(50):
        t = threading.Thread(target=worker, args=(q,))
        t.daemon = True
        t.start()

    q.join()
    print("Scan Complete.")

if __name__ == "__main__":
    main()
This script highlights the importance of understanding **Subnetting** and **CIDR** (Classless Inter-Domain Routing). By iterating through the IP addresses defined by the subnet mask, we can map out the active topology of a Local Area Network (LAN).
Section 2: Modern Implementation and Telemetry Streaming
While active scanning is useful, modern Network Architecture demands real-time telemetry. In the era of Cloud Networking and Microservices, devices and services are ephemeral. Relying solely on static IP lists is a recipe for failure.
Moving to API-Driven Monitoring

Traditional Network Devices (Routers and Switches) were monitored via SNMP. However, modern Software-Defined Networking (SDN) controllers and Cloud infrastructure expose data via **REST APIs**. This shift allows for more granular data collection regarding Network Performance, such as specific interface throughput or error rates on a Load Balancer.
The implementation below simulates a network collector that acts as a middleware. It gathers system metrics (simulating a network node) and pushes them to a central monitoring API. This is a common pattern in **Edge Computing**, where edge devices process data locally before sending summaries to the cloud.
import time
import psutil
import requests
import json
import random

# Configuration for the central monitoring API
API_ENDPOINT = "https://api.monitoring-dashboard.local/v1/telemetry"
DEVICE_ID = "EDGE_NODE_01"

def collect_network_metrics():
    """
    Gathers local network interface statistics.
    Real-world application: Monitoring bandwidth usage on a specific node.
    """
    net_io = psutil.net_io_counters()

    # Simulate latency check to a DNS server (8.8.8.8)
    # In production, use a real ping library
    simulated_latency = random.uniform(10, 45)

    payload = {
        "device_id": DEVICE_ID,
        "timestamp": time.time(),
        "bytes_sent": net_io.bytes_sent,
        "bytes_recv": net_io.bytes_recv,
        "packets_sent": net_io.packets_sent,
        "packets_recv": net_io.packets_recv,
        "latency_ms": round(simulated_latency, 2),
        "status": "ONLINE"
    }
    return payload

def push_telemetry():
    while True:
        try:
            data = collect_network_metrics()

            # Sending data via HTTP Protocol (POST)
            headers = {'Content-Type': 'application/json'}
            response = requests.post(
                API_ENDPOINT,
                data=json.dumps(data),
                headers=headers,
                timeout=5
            )

            if response.status_code == 200:
                print(f"Telemetry sent successfully: {data['latency_ms']}ms latency")
            else:
                print(f"Failed to send telemetry: {response.status_code}")

        except requests.exceptions.RequestException as e:
            print(f"Network Error: {e}")

        # Wait for 10 seconds before next poll
        time.sleep(10)

if __name__ == "__main__":
    print("Starting Telemetry Agent...")
    push_telemetry()
This code represents the “Agent” side of network monitoring. In a Service Mesh architecture, a sidecar container might run similar logic to report on the health of the application it supports.
Section 3: Visualization and Functional Data Processing
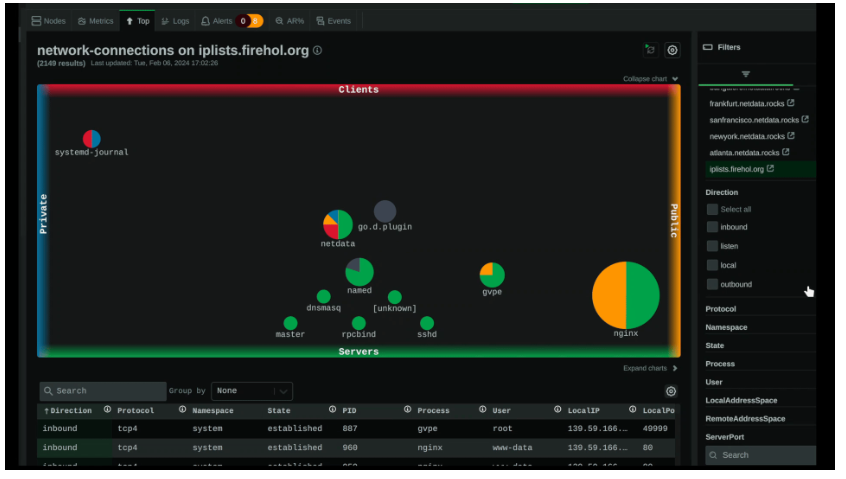
Collecting data is only half the battle. The ability to visualize complex datasets is what allows a Network Engineer to detect anomalies. Modern dashboards often utilize JavaScript frameworks like React to render real-time states.
Functional Programming in Data Analysis
When dealing with streams of network events (e.g., logs from Firewalls, status updates from Wireless Access Points), **Functional Programming** paradigms are incredibly efficient. Concepts like immutability and pure functions help in processing large arrays of sensor data without side effects, which is crucial for maintaining state consistency in a dashboard.
Below is a conceptual React component that utilizes functional methods (`filter`, `map`, `reduce`) to process incoming network alerts. This approach is highly scalable for monitoring environments with hundreds of sensors, such as environmental monitoring or large-scale WiFi deployments.
import React, { useState, useEffect, useMemo } from 'react';
// Mock data representing a stream of network alerts
const rawAlerts = [
{ id: 1, source: 'Router-Core', severity: 'CRITICAL', msg: 'BGP Neighbor Down', timestamp: 162500000 },
{ id: 2, source: 'Switch-Floor1', severity: 'WARNING', msg: 'High CPU Usage', timestamp: 162500100 },
{ id: 3, source: 'Sensor-North', severity: 'INFO', msg: 'Heartbeat OK', timestamp: 162500200 },
{ id: 4, source: 'Firewall-Edge', severity: 'CRITICAL', msg: 'Packet Drop Spike', timestamp: 162500300 },
];
const NetworkDashboard = () => {
const [alerts, setAlerts] = useState(rawAlerts);
const [filterType, setFilterType] = useState('CRITICAL');
// Functional Programming: Pure function to filter alerts
// This does not mutate the original state
const filterAlerts = (data, severity) => {
return data.filter(alert => alert.severity === severity);
};
// Functional Programming: Transformation using map
// Converts timestamps to readable strings for display
const processAlerts = (data) => {
return data.map(alert => ({
...alert,
formattedTime: new Date(alert.timestamp).toLocaleTimeString(),
displayClass: alert.severity === 'CRITICAL' ? 'bg-red-500' : 'bg-yellow-500'
}));
};
// Memoization to optimize performance during high-frequency updates
const visibleAlerts = useMemo(() => {
const filtered = filterType === 'ALL' ? alerts : filterAlerts(alerts, filterType);
return processAlerts(filtered);
}, [alerts, filterType]);
return (
Network Operations Center
{visibleAlerts.map(alert => (
{alert.source}
{alert.msg}
{alert.formattedTime}
))}
{/* Functional Reduce to calculate summary stats */}
Total Critical Issues: {alerts.reduce((acc, curr) =>
curr.severity === 'CRITICAL' ? acc + 1 : acc, 0)}
);
};
export default NetworkDashboard;This example demonstrates how **Network Development** intersects with frontend engineering. By using functional patterns, the dashboard remains responsive and predictable, even when processing rapid updates from thousands of network sensors.
Section 4: Advanced Techniques and Security Considerations
As we integrate more automation and visualization, we must address **Network Security**. Monitoring tools often have privileged access to network devices. If a monitoring server is compromised, it can become a pivot point for attackers.
Securing the Monitoring Plane

1. **Encryption:** All telemetry data should be transmitted over **HTTPS** or encrypted VPN tunnels.
2. **Access Control:** Use strict ACLs (Access Control Lists) to ensure only the monitoring server can poll SNMP data or access APIs.
3. **VLAN Segmentation:** Place management interfaces and monitoring tools on a dedicated Management VLAN, separate from user traffic.
Anomaly Detection with Python
Advanced monitoring goes beyond static thresholds. It involves detecting deviations from the norm. This is particularly relevant in **Wireless Networking** and IoT, where signal patterns can indicate interference or physical tampering. Below is a Python snippet using basic statistical analysis to detect traffic spikes, a potential sign of a DDoS attack or a broadcast storm.
import numpy as np

class TrafficAnalyzer:
    def __init__(self, window_size=10):
        self.history = []
        self.window_size = window_size
        # Multiplier for standard deviation to define a threshold
        self.threshold_factor = 2.5

    def ingest_data_point(self, mbps):
        """
        Ingests a bandwidth reading (Mbps) and checks for anomalies.
        """
        self.history.append(mbps)

        # Maintain a rolling window
        if len(self.history) > self.window_size:
            self.history.pop(0)

        return self.analyze(mbps)

    def analyze(self, current_value):
        if len(self.history) < 5:
            return "LEARNING"

        # Calculate Mean and Standard Deviation
        mean = np.mean(self.history)
        std_dev = np.std(self.history)

        upper_limit = mean + (std_dev * self.threshold_factor)

        if current_value > upper_limit:
            return f"ANOMALY DETECTED: {current_value} Mbps (Threshold: {upper_limit:.2f})"

        return "NORMAL"

# Simulation of traffic flow
analyzer = TrafficAnalyzer()
traffic_pattern = [10, 12, 11, 13, 10, 12, 11, 12, 11, 100] # Sudden spike at the end

print("Starting Traffic Analysis...")
for data_point in traffic_pattern:
    status = analyzer.ingest_data_point(data_point)
    print(f"Input: {data_point} Mbps -> Status: {status}")
This logic is foundational for **Network Virtualization** and automated scaling. If an anomaly is detected, a script could trigger a webhook to a **SDN** controller to rate-limit a port or reroute traffic, effectively automating the response to network threats.
Best Practices for Robust Network Monitoring
To build a monitoring system that aids rather than hinders operations, consider the following best practices:
1. Avoid Alert Fatigue
One of the most common pitfalls in **Network Administration** is configuring every possible alert. If everything is “Critical,” nothing is. Use “Warning” levels for trends that need observation and “Critical” only for service-impacting events. Implement hysteresis (delay) to prevent flapping alerts.
2. Monitor from the User’s Perspective

Green lights on a server dashboard do not mean the user experience is good. Use **Synthetic Monitoring** to simulate user actions (e.g., logging into a web service, retrieving a file). This validates the entire stack, from DNS resolution to the Application Layer.
3. Embrace Redundancy
Your monitoring system needs to be more reliable than the network it monitors. If you are running a centralized monitoring server, what happens if its uplink fails? For critical infrastructure, consider distributed monitoring agents located in different geographic regions or cloud availability zones.
4. Documentation and Topology Mapping
Tools like `Graphviz` or automated mapping software can visualize the relationships between **Routers**, **Switches**, and servers. Keep these maps updated. In a crisis, knowing exactly which switch port connects to the database server is invaluable.
5. Contextualize for Remote Work and Travel Tech
For organizations supporting **Digital Nomads** and **Tech Travel**, monitoring must extend beyond the corporate firewall. Endpoint monitoring tools can assess the quality of a remote worker’s home WiFi or hotel connection, helping distinguish between a corporate VPN issue and a local ISP failure.
Conclusion
Network Monitoring has transformed from a passive, background task into a dynamic, code-driven discipline. By mastering **Network Protocols** like TCP/IP and HTTP, utilizing **Network Libraries** in Python for data collection, and leveraging frontend frameworks for visualization, engineers can build systems that provide deep insights into infrastructure health.
Whether you are deploying **Wireless Sensor Networks** in remote locations or managing high-frequency trading clusters, the principles remain the same: collect accurate data, analyze it for anomalies, and visualize it for rapid decision-making. As **Edge Computing** and **IPv6** adoption continue to grow, the demand for skilled professionals who can bridge the gap between hardware networking and software development will only increase. Start building your own tools today, and gain the visibility needed to keep the world connected.


