In our hyper-connected world, the network is the central nervous system of every digital enterprise. From complex Cloud Networking infrastructures and sprawling Microservices architectures to the simple necessity of reliable connectivity for a Remote Work force, the health of the network directly dictates the performance of applications and the productivity of users. Simply waiting for something to break is no longer a viable strategy. This is where network monitoring transitions from a reactive troubleshooting task to a proactive, strategic discipline. Effective Network Monitoring provides the critical visibility needed to ensure performance, bolster Network Security, and guarantee business continuity.
This article dives deep into the world of network monitoring, exploring its core concepts, practical implementation with code examples, and advanced strategies for modern environments. We’ll cover everything from fundamental metrics and classic tools to the automated, API-driven approaches essential for today’s DevOps and System Administration teams. Whether you’re a seasoned Network Engineer or a developer looking to understand the full stack, this guide will equip you with the knowledge to build a robust monitoring strategy that keeps your digital services running smoothly.
Understanding the Core Pillars of Network Monitoring
Before diving into complex tools and automation, it’s crucial to understand what we are actually trying to measure. Effective network monitoring is built on a foundation of key performance indicators (KPIs) that provide a comprehensive view of network health. These metrics help us move from “the network is slow” to a precise, data-driven diagnosis.
Key Metrics to Monitor
At the heart of any monitoring strategy are the fundamental metrics that quantify network behavior. These include:
- Latency: Often called “ping time,” this is the time it takes for a data packet to travel from its source to its destination and back. High latency is a primary cause of sluggish application performance, especially for interactive services.
- Bandwidth Utilization: This measures the amount of data being transferred over a network link, typically expressed as a percentage of its total capacity. Consistently high utilization can indicate a need for network upgrades or traffic shaping.
- Packet Loss: This is the percentage of packets that are lost in transit and fail to reach their destination. Even a small amount of packet loss can severely degrade the performance of protocols like TCP/IP, leading to retransmissions and delays.
- Jitter: This refers to the variation in latency over time. High jitter is particularly disruptive for real-time applications like VoIP and video conferencing, causing garbled audio and choppy video.
- Availability (Uptime): The most basic metric, this simply tracks whether a network device or service is online and reachable. It’s usually expressed as a percentage over a given period (e.g., 99.99% uptime).
A Practical Example: Basic Availability and Latency Check
One of the simplest yet most effective monitoring tasks is a basic “ping” check. This uses the ICMP protocol to test the reachability of a host and measure round-trip time. We can easily automate this with a simple Python script.
import subprocess
import platform
import time

def check_host_health(hostname):
    """
    Pings a host to check for availability and latency.
    Compatible with both Windows and Unix-like systems.
    """
    # Determine the correct ping command parameter based on the OS
    param = '-n' if platform.system().lower() == 'windows' else '-c'

    # Command to execute
    command = ['ping', param, '1', hostname]

    try:
        # Execute the command
        output = subprocess.check_output(command, stderr=subprocess.STDOUT, universal_newlines=True)

        # A simple way to parse latency (works for many systems)
        if "time=" in output:
            latency_ms = float(output.split('time=')[1].split(' ')[0])
            print(f"SUCCESS: Host {hostname} is reachable. Latency: {latency_ms:.2f} ms.")
            return True, latency_ms
        else:
            print(f"SUCCESS: Host {hostname} is reachable, but latency parsing failed.")
            return True, None

    except subprocess.CalledProcessError as e:
        print(f"FAILURE: Host {hostname} is unreachable. Error: {e.output}")
        return False, None
    except FileNotFoundError:
        print("ERROR: 'ping' command not found. Please ensure it's in your system's PATH.")
        return False, None

# --- Main execution ---
if __name__ == "__main__":
    target_host = "8.8.8.8"  # Google's public DNS server
    is_up, latency = check_host_health(target_host)

    if is_up:
        print(f"Monitoring check for {target_host} passed.")
    else:
        print(f"Monitoring check for {target_host} failed.")
This script provides a foundational building block for any custom monitoring system, allowing you to programmatically verify the basic health of critical servers or Network Devices.
Implementation: Tools, Techniques, and Automation
With a clear understanding of what to monitor, the next step is implementation. The landscape of Network Tools is vast, ranging from simple command-line utilities to sophisticated, distributed platforms. A robust strategy often involves a combination of these tools to achieve different levels of visibility across the OSI Model layers.
The Network Administrator’s Toolkit
Every Network Administration professional relies on a set of core utilities for on-the-spot Network Troubleshooting:
- ping/traceroute: For checking reachability, latency, and the routing path packets take across the Network Layer.
- netstat/ss: To inspect active network connections, listening ports, and routing tables on a local machine.
- Wireshark: An indispensable tool for deep Packet Analysis. It captures and decodes traffic, allowing you to inspect individual packets and diagnose complex issues related to protocols like HTTP Protocol, DNS Protocol, and TCP.
Monitoring Application-Level Performance
Often, network-level metrics are healthy, but an application is still failing. This is why monitoring must extend to the Application Layer. We can write scripts to simulate user interaction, such as making an HTTP request to a web service, to verify its health and measure response time.
import requests
import time

def check_website_status(url, timeout=5):
    """
    Checks the status of a website by making an HTTP GET request.
    Returns the status code, response time, and an error message if any.
    """
    headers = {
        'User-Agent': 'MyMonitoringBot/1.0'
    }
    try:
        start_time = time.time()
        response = requests.get(url, headers=headers, timeout=timeout)
        end_time = time.time()

        response_time_ms = (end_time - start_time) * 1000

        if response.status_code >= 200 and response.status_code < 300:
            print(f"SUCCESS: {url} is UP. Status: {response.status_code}. Response Time: {response_time_ms:.2f} ms.")
            return response.status_code, response_time_ms, None
        else:
            print(f"WARNING: {url} returned a non-success status. Status: {response.status_code}. Response Time: {response_time_ms:.2f} ms.")
            return response.status_code, response_time_ms, f"HTTP Status {response.status_code}"

    except requests.exceptions.RequestException as e:
        print(f"FAILURE: {url} is DOWN. Error: {e}")
        return None, None, str(e)

# --- Main execution ---
if __name__ == "__main__":
    target_url = "https://api.github.com" # A reliable public API
    status, res_time, error = check_website_status(target_url)

    if status:
        print(f"Health check for {target_url} completed.")
    else:
        print(f"Health check for {target_url} failed critically.")
This script leverages the popular requests library in Python to perform a health check on a web endpoint. It's a cornerstone of monitoring for any system that relies on Web Services or a REST API.
Monitoring Local Bandwidth
To understand traffic patterns on a specific server or workstation, we can use libraries that interface with the operating system to gather network statistics. The psutil library in Python is excellent for this cross-platform task.
import psutil
import time

def monitor_bandwidth(interval_seconds=1):
    """
    Monitors and prints network bandwidth usage (bytes sent/received)
    over a specified interval.
    """
    last_net_io = psutil.net_io_counters()

    print("Starting bandwidth monitor... Press Ctrl+C to stop.")
    try:
        while True:
            time.sleep(interval_seconds)

            current_net_io = psutil.net_io_counters()

            bytes_sent = current_net_io.bytes_sent - last_net_io.bytes_sent
            bytes_recv = current_net_io.bytes_recv - last_net_io.bytes_recv

            # Convert to a more readable format (e.g., KB/s)
            sent_kbps = (bytes_sent / interval_seconds) / 1024
            recv_kbps = (bytes_recv / interval_seconds) / 1024

            print(f"Upload: {sent_kbps:.2f} KB/s | Download: {recv_kbps:.2f} KB/s")

            last_net_io = current_net_io

    except KeyboardInterrupt:
        print("\nBandwidth monitor stopped.")
    except Exception as e:
        print(f"An error occurred: {e}")

# --- Main execution ---
if __name__ == "__main__":
    monitor_bandwidth(interval_seconds=2)
This script provides a real-time view of a machine's network throughput, which is invaluable for identifying processes that are consuming excessive Bandwidth or for capacity planning.
Advanced Monitoring for Modern Network Architectures
Modern Network Architecture, characterized by Software-Defined Networking (SDN), Network Virtualization, and ephemeral cloud resources, demands more sophisticated monitoring techniques. Static, manual checks are insufficient in these dynamic environments.
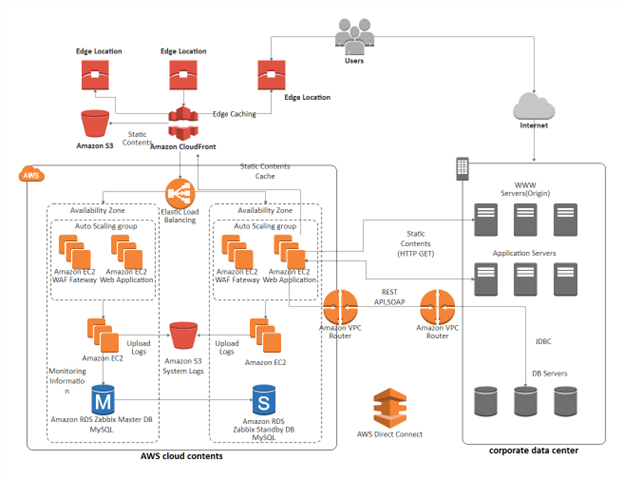
Cloud-Native Monitoring
Major cloud providers like AWS, Azure, and Google Cloud offer powerful, integrated monitoring services. For instance, AWS provides Amazon CloudWatch, which can ingest metrics from various sources, including VPC Flow Logs (for IP traffic analysis), Elastic Load Balancer metrics, and now, dedicated Network Monitoring features that provide visibility into the performance of traffic traversing the global AWS network. These tools allow you to monitor inter-region latency and packet loss within your cloud environment, which is critical for distributed applications and disaster recovery setups.
Network Automation and Programmability
The rise of Network Automation has transformed monitoring. Instead of manually checking devices, engineers now use Network APIs to programmatically query devices for their status, performance metrics, and configuration. This approach, often central to DevOps Networking, allows for the creation of custom monitoring dashboards and automated remediation scripts. For example, a script could detect high latency on a specific path and automatically trigger a process to reroute traffic via a healthier link.
Deep Packet Inspection with Scapy
For the most challenging troubleshooting scenarios, sometimes you need to go beyond standard tools and craft your own packets or perform highly specific analysis. Scapy is a powerful Python library for Network Programming that enables just that. You can build, send, and dissect packets for nearly any protocol, making it an ultimate tool for deep diagnostics and security research.
#!/usr/bin/env python3
from scapy.all import sniff, DNS, DNSQR

def dns_packet_handler(packet):
    """
    This function is called for each sniffed packet.
    It checks if the packet is a DNS query and prints the queried domain.
    """
    # Check if the packet has a DNS layer and a DNS Question Record layer
    if packet.haslayer(DNS) and packet.getlayer(DNS).qr == 0: # qr=0 means it's a query
        if packet.haslayer(DNSQR):
            query_name = packet.getlayer(DNSQR).qname.decode('utf-8')
            print(f"[DNS Query Detected] Client is asking for: {query_name}")

def start_dns_sniffer(interface="eth0", count=10):
    """
    Starts sniffing network traffic on a given interface to capture DNS queries.
    Note: This script typically requires root/administrator privileges to run.
    """
    print(f"[*] Starting DNS sniffer on interface '{interface}' for {count} packets...")
    try:
        # sniff() is a powerful function from Scapy
        # prn: function to call for each packet
        # filter: BPF filter to capture only DNS traffic (port 53)
        # count: number of packets to capture
        # iface: the network interface to sniff on
        sniff(iface=interface, filter="udp port 53", prn=dns_packet_handler, count=count)
        print("[*] Sniffing complete.")
    except PermissionError:
        print("[!] Permission denied. Please run this script with sudo or as an administrator.")
    except OSError as e:
        print(f"[!] Error: Could not find interface '{interface}'. Please check your network interface name. Error: {e}")

# --- Main execution ---
if __name__ == "__main__":
    # Replace "eth0" with your actual network interface name (e.g., "en0" on macOS, "Ethernet" on Windows)
    # You can find it using 'ifconfig' on Linux/macOS or 'ipconfig' on Windows.
    network_interface = "eth0"
    start_dns_sniffer(interface=network_interface, count=20)
This Scapy script acts as a simple DNS query logger. It listens on a network interface and prints out any domain names being requested. This can be incredibly useful for troubleshooting DNS Protocol issues or identifying suspicious network activity.
Best Practices for an Optimized Monitoring Strategy
Deploying tools is only half the battle. An effective monitoring strategy is about process and philosophy as much as it is about technology.
Establish a Performance Baseline
You cannot identify an anomaly if you don't know what "normal" looks like. Collect data over an extended period (days or weeks) to establish a baseline for key metrics like latency, bandwidth, and CPU usage on network devices. This baseline becomes the benchmark against which you can set meaningful alert thresholds.
Configure Intelligent, Actionable Alerts
Alert fatigue is a real problem that causes teams to ignore important notifications. Avoid creating alerts for every minor fluctuation. Instead, focus on alerts that are:
- Sustained: Trigger an alert only if a condition (e.g., high latency) persists for several minutes.
- Correlated: Combine network metrics with application metrics. An alert is more urgent if high packet loss correlates with a spike in application error rates.
- Actionable: Every alert should have a corresponding playbook or set of instructions for remediation.
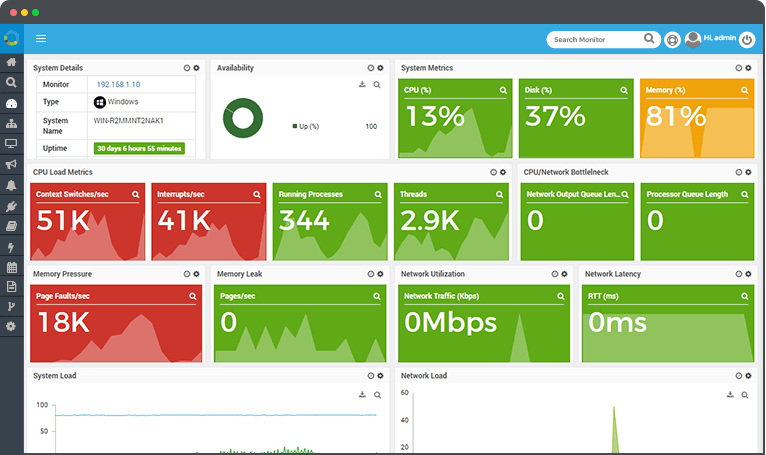
Embrace Holistic Visibility
Don't monitor in silos. A modern application's performance depends on the entire stack: the underlying Network Devices (Routers, Switches), the virtualized network, the operating system, and the application code itself. Use platforms like Prometheus and Grafana to aggregate metrics from all these sources into a single, unified dashboard. This allows you to correlate events across layers and find the root cause of an issue much faster.
Integrate Monitoring with Security
Network Monitoring is a cornerstone of good Network Security. By monitoring traffic flows, you can detect anomalies that may indicate a security breach, such as data exfiltration (unusually high outbound traffic) or a device communicating with a known malicious IP address. Tools like VPC Flow Logs and NetFlow are essential for this security-oriented analysis.
Conclusion: The Future of Network Visibility
Network monitoring has evolved far beyond simple ping checks. In an era defined by cloud computing, Edge Computing, and global workforces, it has become a data-rich, proactive discipline essential for digital success. We've seen that a powerful strategy combines foundational knowledge of the TCP/IP suite with practical scripting skills and an understanding of modern, API-driven monitoring platforms.
By focusing on key metrics, leveraging both classic and cloud-native tools, and adhering to best practices like baselining and intelligent alerting, you can build a resilient and high-performing network. The journey doesn't end here. The next step is to start implementing these concepts: set up a simple monitoring stack with Prometheus and Grafana, write a script to check the health of your critical APIs, or explore the network monitoring capabilities within your cloud provider's console. By taking these proactive steps, you transform the network from a potential point of failure into a strategic, reliable asset.