
Introduction
In the intricate world of Computer Networking, data is the lifeblood that flows through the digital veins of infrastructure. Whether you are a Network Engineer troubleshooting latency issues, a security researcher investigating malware behaviors, or a DevOps Networking specialist optimizing Cloud Networking architecture, the ability to dissect traffic at the packet level is a superpower. Packet Analysis, often referred to as packet sniffing or protocol analysis, involves capturing and interpreting data packets as they traverse a network.
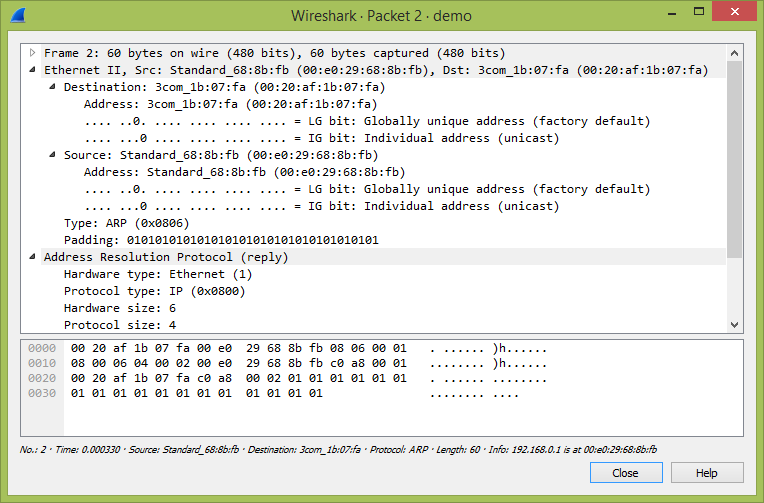
While tools like Wireshark provide a visual interface for this task, modern Network Security demands a more programmatic approach. The recent surge in sophisticated cyber threats highlights the necessity of understanding protocol implementation flaws, such as weak cryptography or predictable sequence numbers. By mastering Network Protocols like TCP/IP, HTTP Protocol, and DNS Protocol, administrators can detect anomalies that Firewalls might miss. This article delves deep into the mechanics of packet analysis, moving from the theoretical OSI Model to practical Socket Programming and security forensics, ensuring you have the skills to protect and optimize any Network Architecture.
Section 1: The Anatomy of Network Traffic
Understanding the OSI Model and Encapsulation
To analyze packets effectively, one must visualize the OSI Model. Data does not travel as a single block; it is encapsulated. When a user sends a request, the Application Layer (e.g., HTTP) wraps the data, which is then passed to the Transport Layer (TCP/UDP), followed by the Network Layer (IP), and finally the Data Link layer (Ethernet). Each layer adds a header containing metadata critical for Routing and Switching.
Network Troubleshooting often begins by verifying these headers. For instance, incorrect Subnetting or CIDR notation in the IP header can cause routing failures. Similarly, Network Performance issues regarding Bandwidth often stem from excessive retransmissions found in the TCP header analysis.
Raw Socket Programming
While Network Tools are useful, understanding Network Programming allows for custom analysis. Below is an example of creating a raw socket in Python. This approach bypasses the normal TCP/IP stack processing, allowing the application to view the raw binary data of the IPv4 or IPv6 packets. This is fundamental for building custom Network Monitoring solutions.
import socket
import struct
import sys

def receive_raw_packets():
    # Create a raw socket (requires root/admin privileges)
    # AF_INET: IPv4, SOCK_RAW: Raw Socket, IPPROTO_TCP: Capture TCP
    try:
        # For Linux/Unix based systems
        s = socket.socket(socket.AF_INET, socket.SOCK_RAW, socket.IPPROTO_TCP)
    except socket.error as msg:
        print(f"Socket could not be created. Error Code: {msg}")
        sys.exit()

    print("Sniffer started. Waiting for packets...")

    while True:
        try:
            # Receive packet
            packet, addr = s.recvfrom(65565)

            # The first 20 bytes are usually the IP Header (in IPv4 without options)
            ip_header = packet[0:20]

            # Unpack the header
            # '!' indicates network byte order (big-endian)
            # 'B' is unsigned char (1 byte), 'H' is unsigned short (2 bytes)
            iph = struct.unpack('!BBHHHBBH4s4s', ip_header)

            version_ihl = iph[0]
            version = version_ihl >> 4
            ihl = version_ihl & 0xF
            iph_length = ihl * 4

            ttl = iph[5]
            protocol = iph[6]
            s_addr = socket.inet_ntoa(iph[8])
            d_addr = socket.inet_ntoa(iph[9])

            print(f"Version: {version} | IP Header Length: {iph_length} bytes")
            print(f"TTL: {ttl} | Protocol: {protocol}")
            print(f"Source IP: {s_addr} | Destination IP: {d_addr}")
            print("-" * 50)

        except KeyboardInterrupt:
            print("Exiting...")
            break

if __name__ == "__main__":
    receive_raw_packets()
This code demonstrates the low-level reality of System Administration. You are manually unpacking bits and bytes. In security contexts, analyzing these raw headers helps identify spoofed source addresses or malformed packets designed to crash Network Devices like Routers and Switches.
Section 2: Programmatic Inspection with Scapy
Moving Beyond Raw Sockets
Raw sockets are powerful but tedious. For sophisticated Network Automation and security analysis, libraries like Scapy are essential. Scapy allows Network Developers to decode, forge, and analyze packets with high-level abstractions. This is particularly useful when dissecting complex Network Standards or analyzing Wireless Networking (WiFi) frames.
In the context of Network Security, analysts often look for patterns indicating command-and-control (C2) communication or data exfiltration. This requires parsing not just the IP header, but the Transport (TCP/UDP) and Application layers. For example, analyzing HTTPS Protocol metadata (during the handshake) can reveal malicious actors even if the payload is encrypted.
Analyzing TCP Sequence Numbers and Flags
One critical aspect of security analysis is examining TCP Sequence numbers. Predictable sequence numbers can lead to TCP hijacking. Furthermore, analyzing TCP flags (SYN, ACK, FIN, RST) is vital for detecting port scans (like SYN floods). The following Python code using Scapy captures packets and analyzes TCP flags to detect potential scanning activity.
from scapy.all import sniff, IP, TCP

# Dictionary to track connection attempts
syn_counter = {}

def analyze_packet(packet):
    # Check if the packet has an IP and TCP layer
    if packet.haslayer(IP) and packet.haslayer(TCP):
        src_ip = packet[IP].src
        dst_ip = packet[IP].dst
        tcp_layer = packet[TCP]

        # Check for SYN flag (0x02) without ACK (0x10)
        # This indicates a connection initiation
        if tcp_layer.flags == 0x02:
            print(f"[+] SYN Packet Detected: {src_ip} -> {dst_ip} : Port {tcp_layer.dport}")

            # Track potential scanning behavior
            if src_ip not in syn_counter:
                syn_counter[src_ip] = 0
            syn_counter[src_ip] += 1

            if syn_counter[src_ip] > 10:
                print(f"[!] ALERT: Potential Port Scanning detected from {src_ip}")

        # Check for RST (Reset) flag, often sent by firewalls or closed ports
        elif tcp_layer.flags & 0x04:
             print(f"[-] RST Packet: Connection reset from {src_ip}")

def start_sniffer(interface="eth0"):
    print(f"Starting capture on {interface}...")
    # store=0 prevents storing packets in memory (good for performance)
    # filter="tcp" ensures we only look at TCP traffic
    sniff(iface=interface, prn=analyze_packet, store=0, filter="tcp")

if __name__ == "__main__":
    # Note: Ensure you run this with appropriate permissions (sudo)
    # Change 'eth0' to your active network interface (e.g., 'wlan0' for WiFi)
    try:
        start_sniffer()
    except PermissionError:
        print("Error: This script requires root/admin privileges.")
This script is a foundational block for an Intrusion Detection System (IDS). By monitoring the state of TCP/IP connections, a Network Administrator can identify unauthorized discovery attempts on the network.
Section 3: Advanced Forensics and Payload Analysis
Detecting Anomalies and Weak Cryptography
Sophisticated malware often attempts to hide its traffic. However, implementation errors, such as vulnerable random number generation in custom protocols or encryption routines, can leave fingerprints. Advanced packet analysis involves looking at the entropy of the payload. High entropy usually indicates encryption or compression, while low entropy might indicate cleartext or padding.
Furthermore, analyzing DNS Protocol traffic is crucial. Attackers frequently use DNS tunneling to bypass Firewalls. By examining the length and randomness of DNS queries, analysts can detect data exfiltration attempts. This level of scrutiny is essential for Software-Defined Networking (SDN) environments and Service Mesh architectures where microservices communicate constantly.

Payload Inspection for Suspicious Patterns
The following example demonstrates how to inspect the payload of UDP packets. In a scenario involving custom malware protocols, the “random” data sent might actually follow a predictable pattern if the RNG (Random Number Generator) is flawed. While we cannot reverse-engineer crypto with a simple script, we can detect repeated patterns or specific signatures.
from scapy.all import sniff, UDP, IP, Raw
import math

def calculate_entropy(data):
    """
    Calculate the Shannon entropy of a byte string.
    Returns a value between 0.0 and 8.0.
    High entropy (>7.5) suggests encryption or compression.
    """
    if not data:
        return 0

    entropy = 0
    for x in range(256):
        p_x = float(data.count(bytes([x]))) / len(data)
        if p_x > 0:
            entropy += - p_x * math.log(p_x, 2)
    return entropy

def inspect_payload(packet):
    if packet.haslayer(UDP) and packet.haslayer(Raw):
        payload = packet[Raw].load
        src_ip = packet[IP].src

        # Calculate entropy
        ent = calculate_entropy(payload)

        # Heuristic analysis
        print(f"Packet from {src_ip} | Payload Len: {len(payload)} | Entropy: {ent:.4f}")

        # If entropy is strangely low for a "secure" protocol, or specific bytes repeat
        if ent < 3.0 and len(payload) > 50:
            print(f"[!] SUSPICIOUS: Low entropy payload detected from {src_ip}. Possible tunneling or padding.")
            # Hex dump for visual inspection
            print(f"    Hex: {payload[:20].hex()}...")

def monitor_udp_traffic():
    print("Monitoring UDP traffic for payload anomalies...")
    sniff(filter="udp", prn=inspect_payload, store=0)

if __name__ == "__main__":
    monitor_udp_traffic()
This approach is vital for Network Security forensics. If a protocol claims to be encrypted but shows low entropy, or if a “random” ID generation shows repeating sequences, it indicates a vulnerability similar to those found in flawed ransomware implementations. This logic applies to API Security as well, ensuring REST API and GraphQL endpoints aren’t leaking predictable tokens.
Section 4: Best Practices and Modern Considerations
Security and Legal Implications
Packet analysis is invasive. Whether you are a Digital Nomad securing your connection in a cafe or a corporate System Administrator, you must adhere to legal standards. Capturing traffic on networks you do not own is illegal. Furthermore, handling PII (Personally Identifiable Information) captured in cleartext HTTP Protocol packets requires strict data governance.
Network Performance and Optimization
When performing analysis on high-speed networks (10Gbps+), Python scripts may introduce Latency or drop packets. For production Network Monitoring, engineers use eBPF (Extended Berkeley Packet Filter) or specialized Network Devices. However, for development and troubleshooting Web Services or Microservices, Python and Wireshark remain the standard.
In the era of Remote Work and Travel Tech, the use of VPN technology is ubiquitous. Analyzing VPN traffic is challenging due to encryption. However, analysts can still monitor the “outer” tunnel for stability, fragmentation issues (MTU size), and connection keep-alives to ensure the Network Design supports the remote workforce effectively.
Automation and DevOps Integration
Modern Network Virtualization and Network APIs allow for automated packet capture. A DevOps Networking pipeline might automatically trigger a packet capture when a Load Balancing health check fails. Integrating these scripts into CI/CD pipelines ensures that Protocol Implementation changes do not introduce security regressions.
Conclusion
Packet analysis is the bedrock of Network Administration and cybersecurity. From understanding the fundamental handshake of TCP/IP to detecting subtle flaws in random number generation within malware payloads, the ability to inspect traffic is invaluable. As Network Architecture evolves toward Edge Computing and Software-Defined Networking, the tools may change, but the principles of the OSI Model and protocol analysis remain constant.
By combining standard tools like Wireshark with custom Python scripts using libraries like Scapy, engineers can gain unparalleled visibility into their networks. Whether you are securing Travel Photography uploads over hotel WiFi or defending enterprise Cloud Networking infrastructure, the insights derived from deep packet inspection are your first line of defense and your ultimate troubleshooting tool.