


In the era of distributed systems, hybrid cloud architectures, and the proliferation of microservices, the role of a Network Engineer has evolved significantly. Network stability is no longer just about ensuring cables are plugged in; it is the backbone of the global digital economy. From high-frequency trading platforms to the Remote Work infrastructure supporting a Digital Nomad, the demand for uptime, low Latency, and high Bandwidth is insatiable. This necessitates a shift from simple status checking to comprehensive Network Monitoring and observability.
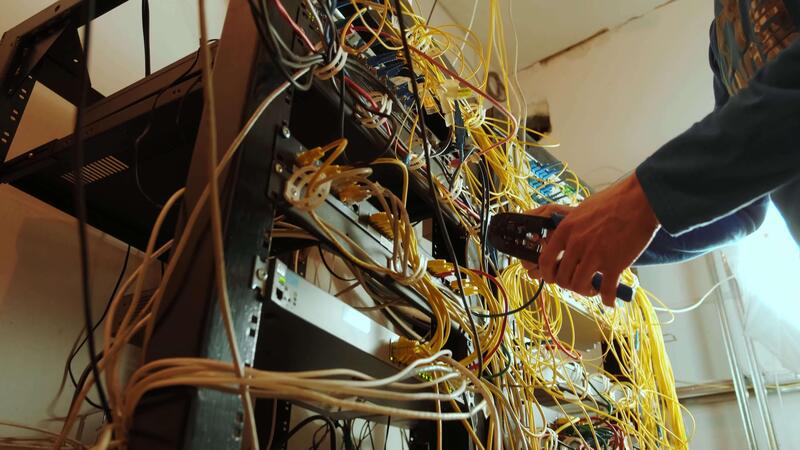
Modern Network Architecture requires a strategic approach to visibility. It involves tracking the health of Network Devices like Routers and Switches, analyzing traffic flows across Firewalls and Load Balancing clusters, and ensuring the security of data in transit. Whether you are dealing with traditional IPv4 infrastructures or transitioning to IPv6, the principles of monitoring remain the bedrock of System Administration and DevOps Networking.
This article provides an in-depth technical exploration of network monitoring strategies, covering core protocols, implementation techniques via Network Programming, and advanced analysis using Packet Analysis tools. We will explore how to balance visibility with long-term data retention costs and ensure your network supports everything from enterprise applications to high-volume Travel Photography data transfers.
Section 1: Core Concepts of Network Observability
To effectively monitor a network, one must understand the underlying Network Protocols and how data moves through the OSI Model. Effective monitoring occurs at multiple layers, primarily the Network Layer (Layer 3), Transport Layer (Layer 4), and the Application Layer (Layer 7).
The Hierarchy of Metrics
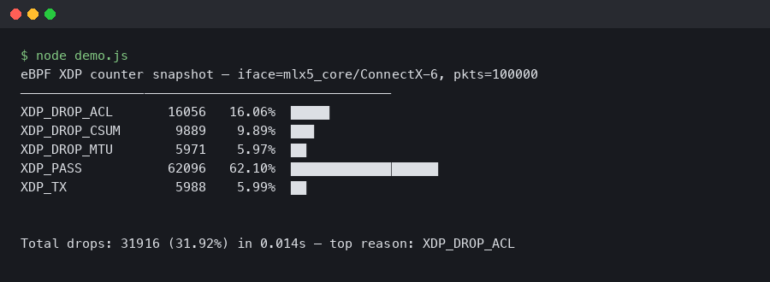
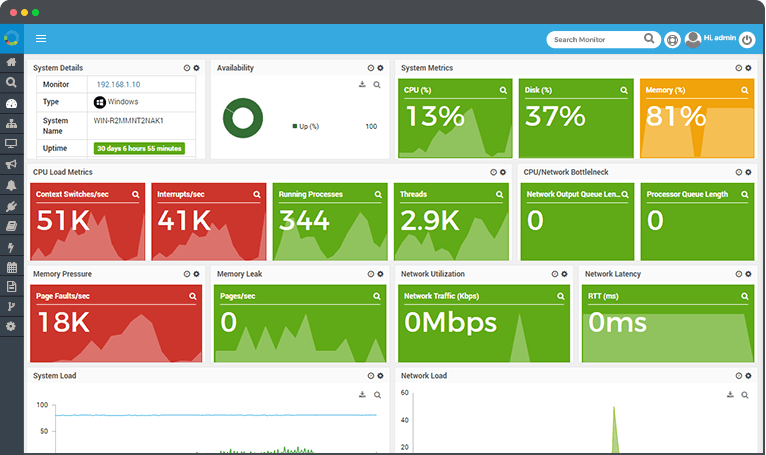
Network monitoring data generally falls into three categories: telemetry (metrics), flow data, and packet data. Telemetry includes CPU usage of devices, memory, and interface error counts. Flow data (NetFlow, sFlow, IPFIX) provides a summary of who is talking to whom, essential for understanding Bandwidth consumption. Packet data involves deep inspection using tools like Wireshark to troubleshoot complex TCP/IP handshake failures or DNS Protocol issues.
Active vs. Passive Monitoring
Passive monitoring analyzes traffic as it passes through the network (e.g., using a SPAN port or TAP). Active monitoring (or synthetic monitoring) involves injecting traffic into the network to measure performance. This is crucial for Service Mesh environments and verifying SLA compliance.
Below is a practical example of Socket Programming in Python. This script acts as a basic active monitor, checking TCP connectivity and measuring the latency of a handshake, which is fundamental for diagnosing Network Performance issues.
import socket
import time
import sys

def check_service_latency(host, port, timeout=5):
    """
    Measures the TCP handshake latency to a specific host and port.
    Useful for monitoring Application Layer availability.
    """
    # Create a raw socket object using IPv4 and TCP
    s = socket.socket(socket.AF_INET, socket.SOCK_STREAM)
    s.settimeout(timeout)

    start_time = time.time()
    try:
        # Attempt to connect to the target
        result = s.connect_ex((host, port))
        end_time = time.time()

        if result == 0:
            latency = (end_time - start_time) * 1000  # Convert to ms
            print(f"[SUCCESS] Connected to {host}:{port} in {latency:.2f} ms")
            return latency
        else:
            print(f"[FAILURE] Port {port} on {host} is closed or unreachable. Error code: {result}")
            return None
    except socket.error as err:
        print(f"[ERROR] Connection failed: {err}")
        return None
    finally:
        s.close()

if __name__ == "__main__":
    # Example: Check DNS Protocol port (53) and HTTP Protocol port (80)
    target_host = "8.8.8.8"
    check_service_latency(target_host, 53)
    check_service_latency("www.google.com", 80)
Section 2: Implementation Details and Device Interrogation
While active monitoring checks services, monitoring the infrastructure requires interrogating Network Devices. Traditionally, this is done via SNMP (Simple Network Management Protocol). However, modern Cloud Networking and Software-Defined Networking (SDN) environments often prefer REST API or streaming telemetry.
Monitoring via SNMP and APIs
For legacy and hardware-based infrastructure (routers, switches), SNMP remains the standard. It allows a Network Administrator to query OIDs (Object Identifiers) to retrieve interface statistics. Understanding Subnetting and CIDR is vital here to map out which segments of the network are generating load.
In contrast, modern Network Automation relies on APIs. Tools like Ansible or Python libraries interact with controllers to fetch state data. This is particularly relevant for Network Virtualization where physical taps are impossible.
The following example demonstrates how to use Python to fetch interface statistics. While production environments might use Prometheus exporters, writing a custom collector is a great way to understand the data structure. This script simulates fetching data from a device API, a common task in Network Development.
import requests
import json

# Simulated API endpoint for a Software-Defined Network controller
CONTROLLER_URL = "https://api.network-controller.local/v1/interfaces"
API_TOKEN = "secure_token_placeholder"

def get_interface_metrics(device_id):
    """
    Fetches throughput and error rates for a specific network device
    via a REST API.
    """
    headers = {
        "Authorization": f"Bearer {API_TOKEN}",
        "Content-Type": "application/json"
    }

    # In a real scenario, you would handle SSL verification properly
    # verify=False is used here for demonstration purposes only
    try:
        response = requests.get(
            f"{CONTROLLER_URL}/{device_id}/stats",
            headers=headers,
            verify=False
        )
        response.raise_for_status()

        data = response.json()

        # Parsing the JSON response
        rx_bytes = data.get('rx_bytes', 0)
        tx_bytes = data.get('tx_bytes', 0)
        errors = data.get('error_count', 0)

        print(f"--- Metrics for Device: {device_id} ---")
        print(f"Inbound Traffic: {rx_bytes / 1024 / 1024:.2f} MB")
        print(f"Outbound Traffic: {tx_bytes / 1024 / 1024:.2f} MB")
        print(f"Interface Errors: {errors}")

        # Simple logic to trigger an alert context
        if errors > 100:
            print("CRITICAL: High error rate detected! Check physical cabling or duplex mismatch.")

    except requests.exceptions.RequestException as e:
        print(f"API Request Failed: {e}")

# Example Usage
# get_interface_metrics("switch-core-01")
Section 3: Advanced Techniques: Packet Analysis and Security
When high-level metrics show a problem (e.g., high latency), but don’t explain why, engineers turn to Packet Analysis. This involves capturing raw frames from the wire (or virtual interface) to inspect headers and payloads. This is the domain of Wireshark and tcpdump.
Deep Packet Inspection (DPI) and Security
Network Security monitoring is a subset of performance monitoring. An unusual spike in UDP traffic might be a DDoS attack, or it might be a new video conference application. Distinguishing between the two requires analyzing the Transport Layer headers. Furthermore, monitoring VPN tunnels is critical for securing Remote Work forces and ensuring that Travel Tech used by employees on the road is not compromising the corporate network.
With the rise of HTTPS Protocol, payload inspection is harder, but analyzing the TLS handshake (part of the Application Layer setup) can reveal certificate issues or cipher suite mismatches. Network Libraries like Scapy allow for programmatic packet manipulation and sniffing, bridging the gap between Network Troubleshooting and Network Programming.
Here is a Python script using the powerful `scapy` library to sniff network traffic and identify unique IP sources. This is a rudimentary form of flow analysis useful for detecting unauthorized devices on a subnet.

from scapy.all import sniff, IP, TCP

# Dictionary to track unique source IPs and packet counts
source_ip_registry = {}

def packet_callback(packet):
    """
    Callback function to process each captured packet.
    Filters for IP traffic and counts occurrences of source IPs.
    """
    if IP in packet:
        src_ip = packet[IP].src
        dst_ip = packet[IP].dst

        # Update counter
        if src_ip in source_ip_registry:
            source_ip_registry[src_ip] += 1
        else:
            source_ip_registry[src_ip] = 1
            print(f"[NEW DEVICE] Detected traffic from: {src_ip} -> {dst_ip}")

        # Basic Protocol Analysis
        if TCP in packet:
            # Check for specific flags (e.g., SYN for connection attempts)
            flags = packet[TCP].flags
            if flags == 'S':
                print(f"   [SYN] Connection attempt from {src_ip} to port {packet[TCP].dport}")

def start_monitor(interface="eth0", count=50):
    print(f"Starting packet capture on {interface}...")
    # Sniff 'count' packets and process them with packet_callback
    # filter="ip" ensures we only look at IPv4 traffic
    sniff(iface=interface, prn=packet_callback, count=count, filter="ip")

    print("\n--- Capture Summary ---")
    for ip, count in source_ip_registry.items():
        print(f"IP: {ip} | Packets Sent: {count}")

# Note: This requires root/admin privileges to access the network interface
# start_monitor()
Section 4: Best Practices, Optimization, and Cost Management
Deploying monitoring tools is easy; managing the data they generate is difficult. A common pitfall in Network Design is “over-monitoring,” where every interface on every switch logs every second. This leads to massive storage costs and “alert fatigue,” where the Network Engineer ignores notifications because there are too many.
Visibility vs. Cost
To balance visibility with cost, adopt a tiered monitoring strategy:
- Core Infrastructure: High-resolution polling (e.g., every 10-30 seconds) for core Routers, Firewalls, and Load Balancers.
- Access Layer: Lower resolution (e.g., every 5 minutes) for access switches connecting end-users.
- Flow Data: Use sampling (e.g., 1 in 1000 packets) for NetFlow/sFlow. This provides statistical accuracy for Bandwidth analysis without overwhelming the collector.
Automation and API Integration
Modern DevOps Networking relies on Infrastructure as Code. Your monitoring configuration should be automated. When a new Microservices cluster spins up, it should automatically register with the monitoring system via GraphQL or REST API. This ensures no “blind spots” are created as the network scales dynamically.
Furthermore, consider the implications of Edge Computing and CDN usage. Monitoring must extend beyond the corporate LAN to the edge where the user resides. For companies involved in Travel Tech or supporting a Digital Nomad workforce, using distributed monitoring agents to test connectivity from various global locations is essential to ensure WiFi and ISP performance isn’t hindering productivity.
Data Retention and Analysis
Long-term data retention is vital for capacity planning. You cannot predict next year’s budget for Network Cables or Ethernet upgrades if you don’t have historical trend data on throughput. However, raw data should be “rolled up” (aggregated) over time. Keep 1-minute granularity for 7 days, 1-hour granularity for 30 days, and 1-day granularity for a year.
# Example: A simple Bash script to check connectivity to multiple endpoints
# This is useful for quick diagnostics on Linux/Unix servers without heavy tools.

#!/bin/bash

TARGETS=("8.8.8.8" "1.1.1.1" "gateway.local")
LOG_FILE="/var/log/network_monitor.log"

echo "Starting Connectivity Check at $(date)" >> $LOG_FILE

for host in "${TARGETS[@]}"
do
    # Ping 3 times, wait 1 second max per ping
    if ping -c 3 -W 1 "$host" &> /dev/null; then
        echo "[OK] $host is reachable"
    else
        echo "[ALERT] $host is DOWN or experiencing 100% packet loss" >> $LOG_FILE
        # Potential integration with alerting API (e.g., PagerDuty/Slack)
        # curl -X POST -H 'Content-type: application/json' --data "{\"text\":\"Host $host is down\"}" HOOK_URL
    fi
done
Conclusion
Network monitoring is a discipline that bridges the gap between hardware physics and software logic. From understanding the nuances of Network Standards and Ethernet framing to implementing sophisticated API Design for automated observability, the modern professional must be versatile. As networks become more complex with Cloud Networking and SDN, the reliance on manual CLI checks diminishes in favor of programmable, automated solutions.
By implementing a strategy that combines active synthetic checks, passive traffic analysis, and intelligent data retention, organizations can achieve high availability while managing costs. Whether you are optimizing a data center or ensuring a seamless connection for Tech Travel and remote work, the tools and techniques discussed here form the foundation of a resilient digital infrastructure. The future of networking is automated, and comprehensive monitoring is the engine that drives it.