


In the intricate ecosystem of modern IT infrastructure, the network is the circulatory system that keeps data flowing between servers, applications, and end-users. Whether you are a seasoned Network Engineer, a DevOps specialist, or a System Administrator, the ability to diagnose and resolve connectivity issues is arguably the most critical skill in your arsenal. Network troubleshooting has evolved significantly from simple connectivity checks to complex analysis involving Software-Defined Networking (SDN), Cloud Networking, and automated remediation via scripts.
When a network bottleneck occurs or connectivity drops, the cost of downtime can be astronomical. This reality demands a comprehensive understanding of Network Architecture, from the physical cabling to the Application Layer protocols. It requires mastery of the TCP/IP stack, a deep understanding of routing and switching, and the ability to wield powerful Network Tools effectively. While graphical interfaces have their place, the true power of diagnostics lies in the command line and custom automation.
This comprehensive guide explores the depths of network diagnostics. We will move beyond basic manual checks to explore advanced Network Programming, packet analysis, and the implementation of automated solutions using PowerShell and Python. We will cover the essential methodologies for isolating issues within the OSI Model, managing Network Security, and ensuring optimal Network Performance across both local and cloud environments.
Section 1: The Foundation – Modern CLI Diagnostics and PowerShell
Before diving into complex code, one must master the foundational command-line tools that interact directly with the OS network stack. Traditional commands like ping, tracert (or traceroute), and netstat remain relevant, but modern operating systems offer significantly more powerful alternatives. In the Windows ecosystem, PowerShell has revolutionized how administrators approach Network Troubleshooting.
Understanding the Transport and Network Layers
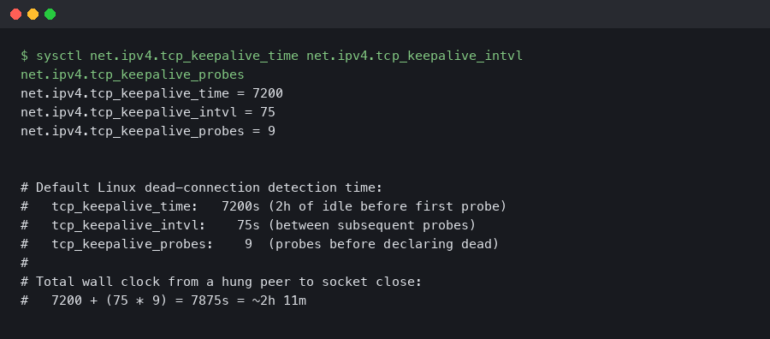
Most connectivity issues stem from misconfigurations at the Network Layer (Layer 3) or the Transport Layer (Layer 4). Issues here often involve IPv4 or IPv6 addressing errors, incorrect Subnetting, or firewall rules blocking specific ports. While a standard ping uses ICMP to check reachability, it does not guarantee that a specific service (like a Web Service on port 80 or 443) is accessible. This is where TCP connection testing becomes vital.
PowerShell’s Test-NetConnection is a robust cmdlet that supersedes several older utilities. It allows for port-specific testing, route tracing, and detailed information gathering in a single execution. This is particularly useful for verifying connectivity to specific endpoints, such as checking if a REST API server is listening before attempting to send data.
Below is a practical PowerShell script designed to audit multiple servers for both ICMP reachability and specific port availability. This script is essential for Network Administration tasks where you need to verify the status of a fleet of servers or a Microservices architecture.
<#
.SYNOPSIS
    Bulk Network Diagnostic Tool
.DESCRIPTION
    Tests connectivity and port availability for a list of endpoints.
    Useful for quick diagnostics of web servers and database connectivity.
#>

$TargetServers = @(
    @{ Name = "google.com"; Port = 443; Service = "HTTPS Protocol" },
    @{ Name = "1.1.1.1"; Port = 53; Service = "DNS Protocol" },
    @{ Name = "internal-db-prod"; Port = 1433; Service = "SQL Database" }
)

foreach ($target in $TargetServers) {
    Write-Host "Testing connection to $($target.Name) on port $($target.Port) ($($target.Service))..." -ForegroundColor Cyan

    try {
        # Perform the network test
        $result = Test-NetConnection -ComputerName $target.Name -Port $target.Port -InformationLevel Quiet

        if ($result) {
            Write-Host "[SUCCESS] $($target.Name) is reachable on port $($target.Port)." -ForegroundColor Green
        }
        else {
            Write-Host "[FAILURE] $($target.Name) is unreachable or port $($target.Port) is blocked." -ForegroundColor Red

            # Basic fallback diagnostic: Check DNS resolution
            try {
                $dns = Resolve-DnsName -Name $target.Name -ErrorAction Stop
                Write-Host "  - DNS Resolution: OK ($($dns.IPAddress))" -ForegroundColor Yellow
            }
            catch {
                Write-Host "  - DNS Resolution: FAILED" -ForegroundColor Red
            }
        }
    }
    catch {
        Write-Host "[ERROR] Could not initiate test for $($target.Name)." -ForegroundColor Red
    }
    Write-Host "------------------------------------------------"
}
This script highlights the importance of distinguishing between name resolution failures (DNS Protocol) and actual port blockage (Firewalls). By automating these checks, a Network Engineer can rapidly identify if an outage is caused by a DNS misconfiguration or a Transport Layer blockage.
Section 2: Network Programming and Socket Analysis with Python
While shell scripts are excellent for quick checks, deep Network Troubleshooting and Network Development often require the precision of a programming language like Python. Python provides low-level access to the operating system’s network interface via Socket Programming. This allows engineers to craft custom packets, simulate specific traffic patterns, and diagnose issues that standard tools might miss.
Latency, Bandwidth, and Port Scanning
Understanding Latency and Bandwidth is crucial for maintaining high-performance applications, especially in the context of Cloud Networking and Edge Computing. A high-latency connection can ruin the user experience even if the bandwidth is ample. Furthermore, security professionals often need to scan networks to ensure only authorized ports are open, a practice central to Network Security.
The following Python example utilizes the socket library to create a custom port scanner that also measures the TCP handshake time (latency). This is a fundamental example of Network Programming that bypasses higher-level abstractions to interact directly with the stack.
import socket
import time
import sys

def analyze_target(host, ports):
    """
    Scans a target host for open ports and measures TCP handshake latency.
    """
    print(f"Starting analysis for target: {host}")
    print("-" * 60)

    try:
        # Resolve the hostname to an IP address (DNS Protocol check)
        target_ip = socket.gethostbyname(host)
        print(f"Resolved {host} to {target_ip}")
    except socket.gaierror:
        print(f"Hostname could not be resolved. Check DNS settings.")
        return

    for port in ports:
        # Create a raw socket object
        s = socket.socket(socket.AF_INET, socket.SOCK_STREAM)
        s.settimeout(2) # Set a timeout for the connection attempt

        start_time = time.time()
        try:
            # Attempt TCP Handshake
            result = s.connect_ex((target_ip, port))
            end_time = time.time()

            latency = (end_time - start_time) * 1000 # Convert to milliseconds

            if result == 0:
                service_name = "Unknown"
                try:
                    service_name = socket.getservbyport(port)
                except:
                    pass
                print(f"Port {port:<5} [OPEN] - Service: {service_name:<10} - Latency: {latency:.2f}ms")
            else:
                print(f"Port {port:<5} [CLOSED/FILTERED]")

        except Exception as e:
            print(f"Error scanning port {port}: {e}")
        finally:
            s.close()

if __name__ == "__main__":
    # Example usage: Scanning common web and infrastructure ports
    target_host = "scanme.nmap.org"
    target_ports = [22, 80, 443, 8080, 3389]

    analyze_target(target_host, target_ports)
This script demonstrates the mechanics of the Transport Layer. By initiating a connect_ex call, we are attempting the first steps of the TCP three-way handshake. If the server responds with a SYN-ACK, the port is open. If it times out or rejects the connection, we know there is a firewall or service issue. This level of granularity is essential when debugging complex Service Mesh configurations or Load Balancing issues.
Section 3: Advanced Packet Analysis and Protocol Inspection
Sometimes, knowing a port is open is not enough. You need to know what is flowing through the wire. This brings us to Packet Analysis. While tools like Wireshark are the gold standard for visual inspection, automating packet analysis requires libraries like Scapy (Python). This is vital for detecting network anomalies, analyzing Protocol Implementation, and verifying that encryption (HTTPS Protocol) is being applied correctly.
Analyzing Traffic Patterns
In a Software-Defined Networking (SDN) environment or when managing Network Virtualization, traffic patterns can be dynamic and unpredictable. An administrator might need to verify if a specific machine is flooding the network with broadcast traffic or if ARP spoofing is occurring.
The following example uses Python with Scapy to sniff network traffic in real-time and summarize the protocol distribution. This helps in identifying if a network segment is saturated with non-essential traffic, affecting overall Network Performance.
from scapy.all import sniff, IP, TCP, UDP, ICMP
from collections import Counter

# Counter to track protocol statistics
protocol_counts = Counter()

def packet_callback(packet):
    """
    Callback function to process each captured packet.
    Extracts IP layer information and counts protocols.
    """
    if IP in packet:
        src_ip = packet[IP].src
        dst_ip = packet[IP].dst
        proto = packet[IP].proto

        # Map protocol numbers to names
        proto_name = "Other"
        if proto == 6:
            proto_name = "TCP"
        elif proto == 17:
            proto_name = "UDP"
        elif proto == 1:
            proto_name = "ICMP"

        protocol_counts[proto_name] += 1

        # Display real-time summary every 10 packets
        total_packets = sum(protocol_counts.values())
        if total_packets % 10 == 0:
            print(f"\n--- Traffic Summary ({total_packets} packets captured) ---")
            for p, count in protocol_counts.items():
                print(f"{p}: {count} packets")
            print(f"Latest: {src_ip} -> {dst_ip} [{proto_name}]")

def start_monitor(interface=None, count=50):
    print(f"Starting packet capture on interface: {interface if interface else 'Default'}")
    print("Press Ctrl+C to stop manually if not limited by count.")

    # Sniff packets (requires root/admin privileges)
    # filter="ip" ensures we only look at IP traffic
    sniff(iface=interface, prn=packet_callback, filter="ip", count=count)

if __name__ == "__main__":
    # Note: Scapy requires running the script with Administrator/Root privileges
    # to access the network interface card in promiscuous mode.
    try:
        start_monitor(count=100)
    except PermissionError:
        print("Error: Packet sniffing requires elevated privileges (sudo/Run as Admin).")
This script touches on the core of Network Security and monitoring. By analyzing the ratio of TCP to UDP traffic, or spotting unexpected ICMP spikes, a Network Engineer can detect potential Denial of Service (DoS) attacks or misconfigured devices broadcasting excessively.
Section 4: Cloud Networking, APIs, and Best Practices
The landscape of networking has shifted towards Network Automation and API-driven infrastructure. In modern DevOps Networking, you are less likely to manually log into a router and more likely to interact with a REST API or GraphQL endpoint to configure a Virtual Private Cloud (VPC). Understanding API Design and API Security is now a prerequisite for troubleshooting.
Troubleshooting Remote Access and APIs
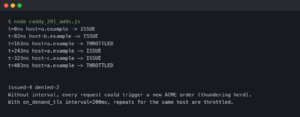
With the rise of Remote Work, the "Digital Nomad" lifestyle, and Tech Travel, ensuring secure and reliable VPN connections is paramount. Troubleshooting often involves verifying that the API endpoints managing these connections are healthy. If a Load Balancer fails to distribute traffic or a CDN (Content Delivery Network) node goes down, the issue isn't a cable; it's a service failure.
Here is an example of how to use Python to check the health of a web service or API endpoint, handling HTTP status codes and timeouts gracefully. This is essential for monitoring Web Services and Microservices.
import requests
import json

def check_api_health(url, headers=None):
    """
    Checks the health of a REST API endpoint.
    Analyzes status codes and response time.
    """
    print(f"Checking API Health: {url}")

    try:
        # Send a GET request with a timeout
        response = requests.get(url, headers=headers, timeout=5)

        status = response.status_code
        latency = response.elapsed.total_seconds() * 1000

        print(f"Status Code: {status}")
        print(f"Response Time: {latency:.2f} ms")

        if 200 <= status < 300:
            print("[OK] Service is healthy.")
            # Optional: Parse JSON to check specific application logic
            try:
                data = response.json()
                print(f"Payload sample: {str(data)[:100]}...")
            except json.JSONDecodeError:
                print("Response is not valid JSON.")
        elif 400 <= status < 500:
            print(f"[CLIENT ERROR] Check request format or API keys. ({status})")
        elif 500 <= status < 600:
            print(f"[SERVER ERROR] The backend service is failing. ({status})")

    except requests.exceptions.Timeout:
        print("[TIMEOUT] The server took too long to respond. Potential network congestion or overload.")
    except requests.exceptions.ConnectionError:
        print("[CONNECTION ERROR] Failed to connect. Check DNS or Firewall.")
    except Exception as e:
        print(f"[ERROR] An unexpected error occurred: {e}")

if __name__ == "__main__":
    # Example: Checking a public API
    api_url = "https://jsonplaceholder.typicode.com/todos/1"

    # Simulate an API Key header for security context
    secure_headers = {"Authorization": "Bearer dummy_token_123"}

    check_api_health(api_url, secure_headers)
Best Practices for Network Troubleshooting
Regardless of the tools or scripts you use, adhering to a structured methodology is key to success. Here are critical best practices for every Network Engineer:
- Start with the Physical Layer: Never underestimate the possibility of a bad cable. Before debugging complex BGP routing, ensure the interface is "up/up" and the Ethernet cables are intact.
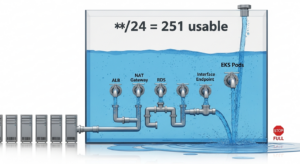
- Understand CIDR and Subnetting: Many connectivity issues arise from overlapping IP ranges or incorrect subnet masks. Mastery of CIDR (Classless Inter-Domain Routing) is non-negotiable.
- Baseline Your Network: You cannot detect anomalies (like high latency) if you don't know what "normal" looks like. Use monitoring tools to establish baseline metrics for Bandwidth and throughput.
- Security First: Always consider Firewalls (both host-based and network appliances) and ACLs. If
pingworks but HTTP fails, it is almost certainly a Layer 4 security restriction. - Document Everything: In complex Network Design, documentation is your map. Keep topologies updated, especially when dealing with invisible infrastructure like Virtual LANs (VLANs) or VPN tunnels.
Conclusion
Network Troubleshooting is a discipline that bridges the gap between hardware physics and abstract software logic. It requires a versatile skillset that spans from understanding how light moves through fiber optics to how a JSON payload is parsed by a REST API. As networks become more automated through Software-Defined Networking and more distributed via Edge Computing, the reliance on manual tools will decrease in favor of the programmatic approaches demonstrated in this article.
By mastering the command line with PowerShell, understanding the low-level interactions with Python sockets, and analyzing traffic with Scapy, you position yourself not just as a troubleshooter, but as a true architect of connectivity. Whether you are supporting a global enterprise or ensuring your Travel Photography blog stays online while working remotely, these skills form the bedrock of the digital experience. Continue to explore, script, and automate; the network is always talking, you just need to know how to listen.