

Introduction
In our hyper-connected world, the network is the invisible backbone of everything we do, from enterprise cloud applications to the simple act of working remotely from a café. When this backbone falters, productivity grinds to a halt, services become unavailable, and frustration mounts. This makes network troubleshooting one of the most critical and valuable skills for any technology professional, including System Administrators, DevOps practitioners, and Network Engineers. Effective troubleshooting is not a dark art; it’s a systematic science that combines a solid understanding of foundational principles with a mastery of powerful tools.
This article will guide you through the methodical process of diagnosing and resolving network issues. We’ll start with the fundamental layered approach inspired by the OSI model, move on to essential command-line utilities, dive deep into the world of packet analysis with tools like Wireshark and Scapy, and explore modern challenges in cloud and automated environments. Whether you’re debugging a slow application, a failed connection, or planning a more resilient network architecture, the principles and practical examples here will equip you to tackle problems with confidence and precision.
Section 1: The Foundation: A Layered Approach and Essential Tools
The most effective network troubleshooting methodology is a structured one. Instead of randomly guessing the cause of a problem, a systematic approach saves time and leads to more accurate conclusions. The OSI (Open Systems Interconnection) model provides an excellent conceptual framework for this, dividing network communication into seven distinct layers. Troubleshooting often involves starting at the bottom (Physical Layer) and working your way up, or starting at the top (Application Layer) and working down.
Understanding the OSI Model in Troubleshooting
A simple “bottom-up” check might look like this:
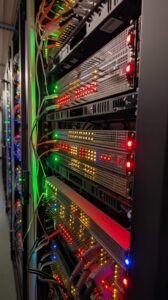
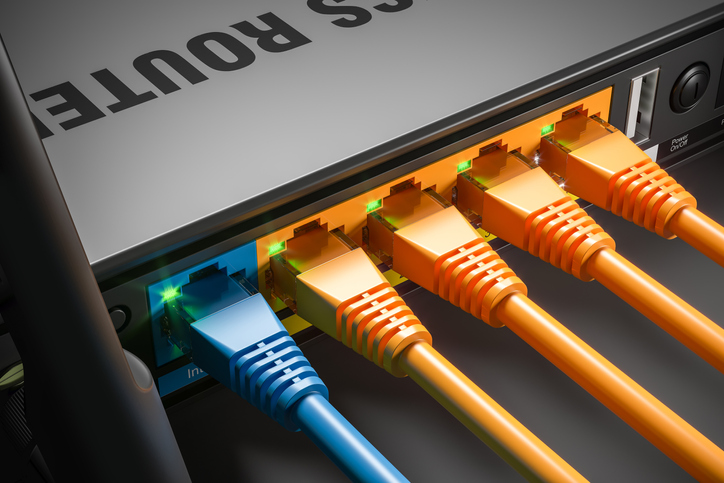
- Layer 1 (Physical): Is the network cable plugged in? Are the link lights on the switch and network card active? This layer covers all physical connectivity, including cables and hubs.
- Layer 2 (Data Link): Is the switch port configured correctly? Are there any MAC address conflicts? This is the realm of Ethernet and network switches.
- Layer 3 (Network): Does the device have a valid IP address? Can it ping its default gateway? This is where IP addressing (IPv4/IPv6), subnetting, and routing live.
- Layer 4 (Transport): Is a firewall blocking the required TCP or UDP port? This layer manages the end-to-end connection via protocols like TCP and UDP.
- Layer 7 (Application): Is the DNS name resolving correctly? Is the webserver application running? This is where protocols like HTTP, HTTPS, and DNS operate.
Command-Line Kung Fu: Your First Responders
Before launching complex tools, a few simple commands can reveal a wealth of information. These are the first responders of network diagnostics.
ping: Uses the ICMP protocol to test basic reachability and measure latency between two hosts. A failed ping is a strong indicator of a fundamental connectivity or firewall issue.traceroute(ortracerton Windows): Maps the hop-by-hop path that packets take from your device to a destination. It’s invaluable for identifying where in the path a connection is failing or experiencing high latency.nslookup/dig: These tools are used to query the Domain Name System (DNS). If you can reach an IP address but not a domain name, the problem is almost certainly DNS-related.
We can combine these into a simple diagnostic script to automate the initial checks.
#!/bin/bash

# A simple network diagnostic script

TARGET_HOST="google.com"

echo "--- Starting Network Diagnostics for ${TARGET_HOST} ---"

# 1. Check DNS Resolution
echo "[INFO] 1. Resolving DNS for ${TARGET_HOST}..."
IP_ADDRESS=$(nslookup ${TARGET_HOST} | awk '/^Address: / { print $2 }')

if [ -z "${IP_ADDRESS}" ]; then
    echo "[ERROR] DNS resolution failed for ${TARGET_HOST}. Exiting."
    exit 1
else
    echo "[SUCCESS] ${TARGET_HOST} resolved to ${IP_ADDRESS}"
fi

# 2. Check Reachability and Latency with Ping
echo -e "\n[INFO] 2. Pinging ${TARGET_HOST} (4 packets)..."
ping -c 4 ${TARGET_HOST}

# Check the exit code of ping
if [ $? -ne 0 ]; then
    echo "[WARNING] Ping failed. Host may be down or blocking ICMP."
else
    echo "[SUCCESS] Ping was successful."
fi

# 3. Trace the route to the host
echo -e "\n[INFO] 3. Tracing route to ${TARGET_HOST}..."
traceroute ${TARGET_HOST}

echo -e "\n--- Diagnostics Complete ---"
Section 2: Diving Deeper with Packet Analysis
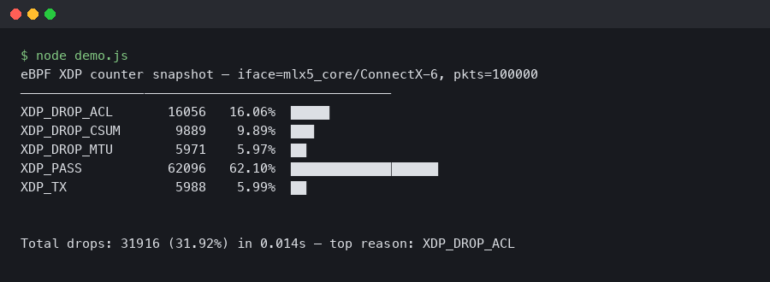
When command-line tools aren’t enough, you need to look at the raw data: the packets themselves. Packet analysis is the process of capturing and inspecting the data flowing across a network. It provides the ultimate “ground truth” and can uncover subtle issues related to protocol handshakes, malformed data, or unexpected traffic patterns that other tools would miss. The two most essential tools for this are Wireshark (a powerful GUI tool) and tcpdump (a lightweight command-line utility).
Capturing Live Traffic with tcpdump
tcpdump is a powerful command-line packet analyzer that is available on virtually all Linux/Unix-like systems. It’s perfect for capturing traffic on remote servers or in automated scripts where a GUI is not available. Its power lies in its filtering capabilities, allowing you to zero in on the exact traffic you need to inspect.
For example, to troubleshoot a web server issue, you might want to capture all traffic on port 80 (HTTP). The following command captures traffic on the eth0 interface destined for port 80 and saves it to a file for later analysis.
# Capture the first 1000 packets on interface eth0 for HTTP traffic (port 80)
# -i eth0: Specify the network interface
# -n: Don't resolve hostnames (faster)
# -s 0: Capture the full packet size
# -c 1000: Capture 1000 packets and then stop
# -w http_capture.pcap: Write the output to a file named http_capture.pcap
# port 80: The filter expression to capture only traffic on port 80

sudo tcpdump -i eth0 -n -s 0 -c 1000 -w http_capture.pcap port 80
The resulting .pcap file can then be opened in Wireshark for detailed graphical analysis or processed programmatically.
Programmatic Analysis with Python and Scapy
For network automation and advanced analysis, you can use libraries like Scapy in Python to dissect and even craft your own packets. Scapy can read .pcap files, making it an excellent tool for analyzing captured data in an automated fashion. Imagine you have a large capture file and want to quickly identify all the unique destination IPs for DNS queries. Scapy makes this trivial.
The following Python script uses Scapy to read a capture file and print out a summary of all DNS queries it finds.
from scapy.all import rdpcap, DNS, DNSQR

def analyze_dns_queries(pcap_file):
    """
    Reads a pcap file and prints out all DNS queries found.

    Prerequisites:
    - Install scapy: pip install scapy
    """
    try:
        packets = rdpcap(pcap_file)
    except FileNotFoundError:
        print(f"Error: File '{pcap_file}' not found.")
        return

    dns_queries = set()

    print(f"--- Analyzing DNS Queries in {pcap_file} ---")

    # Iterate through each packet in the capture
    for packet in packets:
        # Check if the packet has a DNS layer and is a query (qr=0)
        if packet.haslayer(DNS) and packet.getlayer(DNS).qr == 0:
            # DNSQR stands for DNS Question Record
            if packet.haslayer(DNSQR):
                query_name = packet.getlayer(DNSQR).qname.decode('utf-8')
                dns_queries.add(query_name)

    if dns_queries:
        print("Found the following unique DNS queries:")
        for query in sorted(list(dns_queries)):
            print(f"- {query}")
    else:
        print("No DNS queries found in the capture file.")

if __name__ == "__main__":
    # Replace 'network_capture.pcap' with the path to your capture file
    analyze_dns_queries('network_capture.pcap')
Section 3: Troubleshooting in Modern and Automated Environments
Networking has evolved significantly with the rise of cloud computing, Software-Defined Networking (SDN), and microservices. Troubleshooting in these environments requires a different set of skills and tools, as the underlying physical network is often abstracted away.
Challenges in Cloud Networking and SDN
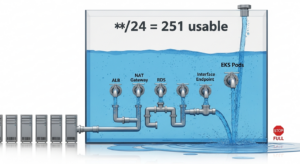
In a cloud environment like AWS or Azure, you don’t troubleshoot a physical switch or router. Instead, you interact with virtual constructs:
- Virtual Private Clouds (VPCs): Isolated virtual networks.
- Security Groups / Network Security Groups (NSGs): Stateful firewalls at the instance level.
- Network Access Control Lists (NACLs): Stateless firewalls at the subnet level.
- Route Tables: Control traffic flow between subnets and to the internet.
A common issue is a misconfigured Security Group blocking necessary traffic. Troubleshooting involves methodically checking these configurations in the cloud provider’s console or via their CLI, rather than plugging in a console cable to a physical device.
Network Automation and APIs
Modern network administration heavily relies on automation. Network devices and cloud services expose REST APIs that allow for programmatic configuration and monitoring. This is a core principle of DevOps networking. Instead of manually checking the status of a switch port, you can write a script to query the device’s API.
This Python script uses the popular requests library to query a hypothetical network device’s API to get the status of its interfaces. This same principle applies to querying cloud provider APIs for security group rules or routing table entries.
import requests
import json

# --- Configuration for a hypothetical network device API ---
DEVICE_IP = "192.168.1.1"
API_ENDPOINT = f"https://{DEVICE_IP}/api/v1/interfaces"
API_KEY = "your_super_secret_api_key"

HEADERS = {
    "Authorization": f"Bearer {API_KEY}",
    "Content-Type": "application/json"
}

def check_interface_status():
    """
    Queries a network device's REST API to check interface status.
    """
    print(f"--- Querying device at {DEVICE_IP} for interface status ---")
    try:
        # Note: In a real scenario, you would handle SSL verification properly
        response = requests.get(API_ENDPOINT, headers=HEADERS, verify=False)

        # Check if the request was successful
        response.raise_for_status()

        interfaces = response.json().get("data", [])

        if not interfaces:
            print("No interfaces found or API response format is incorrect.")
            return

        print("Interface Status Report:")
        print("-" * 30)
        for interface in interfaces:
            name = interface.get("name")
            status = interface.get("status")
            speed = interface.get("speed")
            print(f"  Interface: {name:<10} | Status: {status:<10} | Speed: {speed}")
        print("-" * 30)

    except requests.exceptions.RequestException as e:
        print(f"[ERROR] Could not connect to the device API: {e}")
    except json.JSONDecodeError:
        print("[ERROR] Failed to decode JSON response from the API.")

if __name__ == "__main__":
    check_interface_status()
Section 4: Best Practices and Proactive Monitoring
The best troubleshooting is the kind you don't have to do. A proactive approach focused on monitoring and best practices can prevent many issues from ever impacting users.
Establish a Performance Baseline
You can't know if something is slow if you don't know what "fast" looks like. Use network monitoring tools to establish a baseline for key metrics like latency, jitter, bandwidth utilization, and packet loss. When an issue arises, you can compare current metrics against the baseline to quickly quantify the problem's impact.
Implement Comprehensive Monitoring
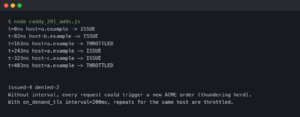
Tools like Prometheus, Grafana, Zabbix, and Datadog are essential for modern network administration. They provide real-time visibility into the health of network devices, servers, and applications. Configure alerts for critical thresholds (e.g., high latency to a key service, a switch port going down) to be notified of problems before your users are.
Document Everything
An up-to-date network diagram is one of the most valuable troubleshooting tools you can have. This documentation should include IP addressing schemes (CIDR blocks), VLAN configurations, firewall rules, and physical connections. When you're under pressure to resolve an outage, you won't have time to reverse-engineer your own network.
Tips for Remote Work and Digital Nomads
These principles scale down to personal networks. For those engaged in remote work, understanding your local network is key. Use ping to check your connection quality to your company's VPN. Troubleshoot slow WiFi by checking for channel interference. A solid understanding of basic network troubleshooting ensures your productivity isn't derailed by a flaky connection, a crucial skill in the world of tech travel.
Conclusion
Network troubleshooting is a deep and rewarding discipline that blends foundational knowledge with modern, automated tooling. We've seen that a successful approach is always systematic, starting with the OSI model as a mental map. From there, we progress from basic command-line utilities like ping and traceroute to the forensic detail of packet analysis with tcpdump and Scapy. In today's cloud-centric and automated world, the skill set has expanded to include interacting with network APIs and understanding virtualized network constructs.
By adopting best practices like establishing baselines, implementing robust monitoring, and maintaining clear documentation, you can shift from a reactive to a proactive stance. The network will continue to grow in complexity, but the core principles of methodical investigation remain constant. Continue to build on these fundamentals, and you'll be well-equipped to diagnose and resolve any network challenge that comes your way.